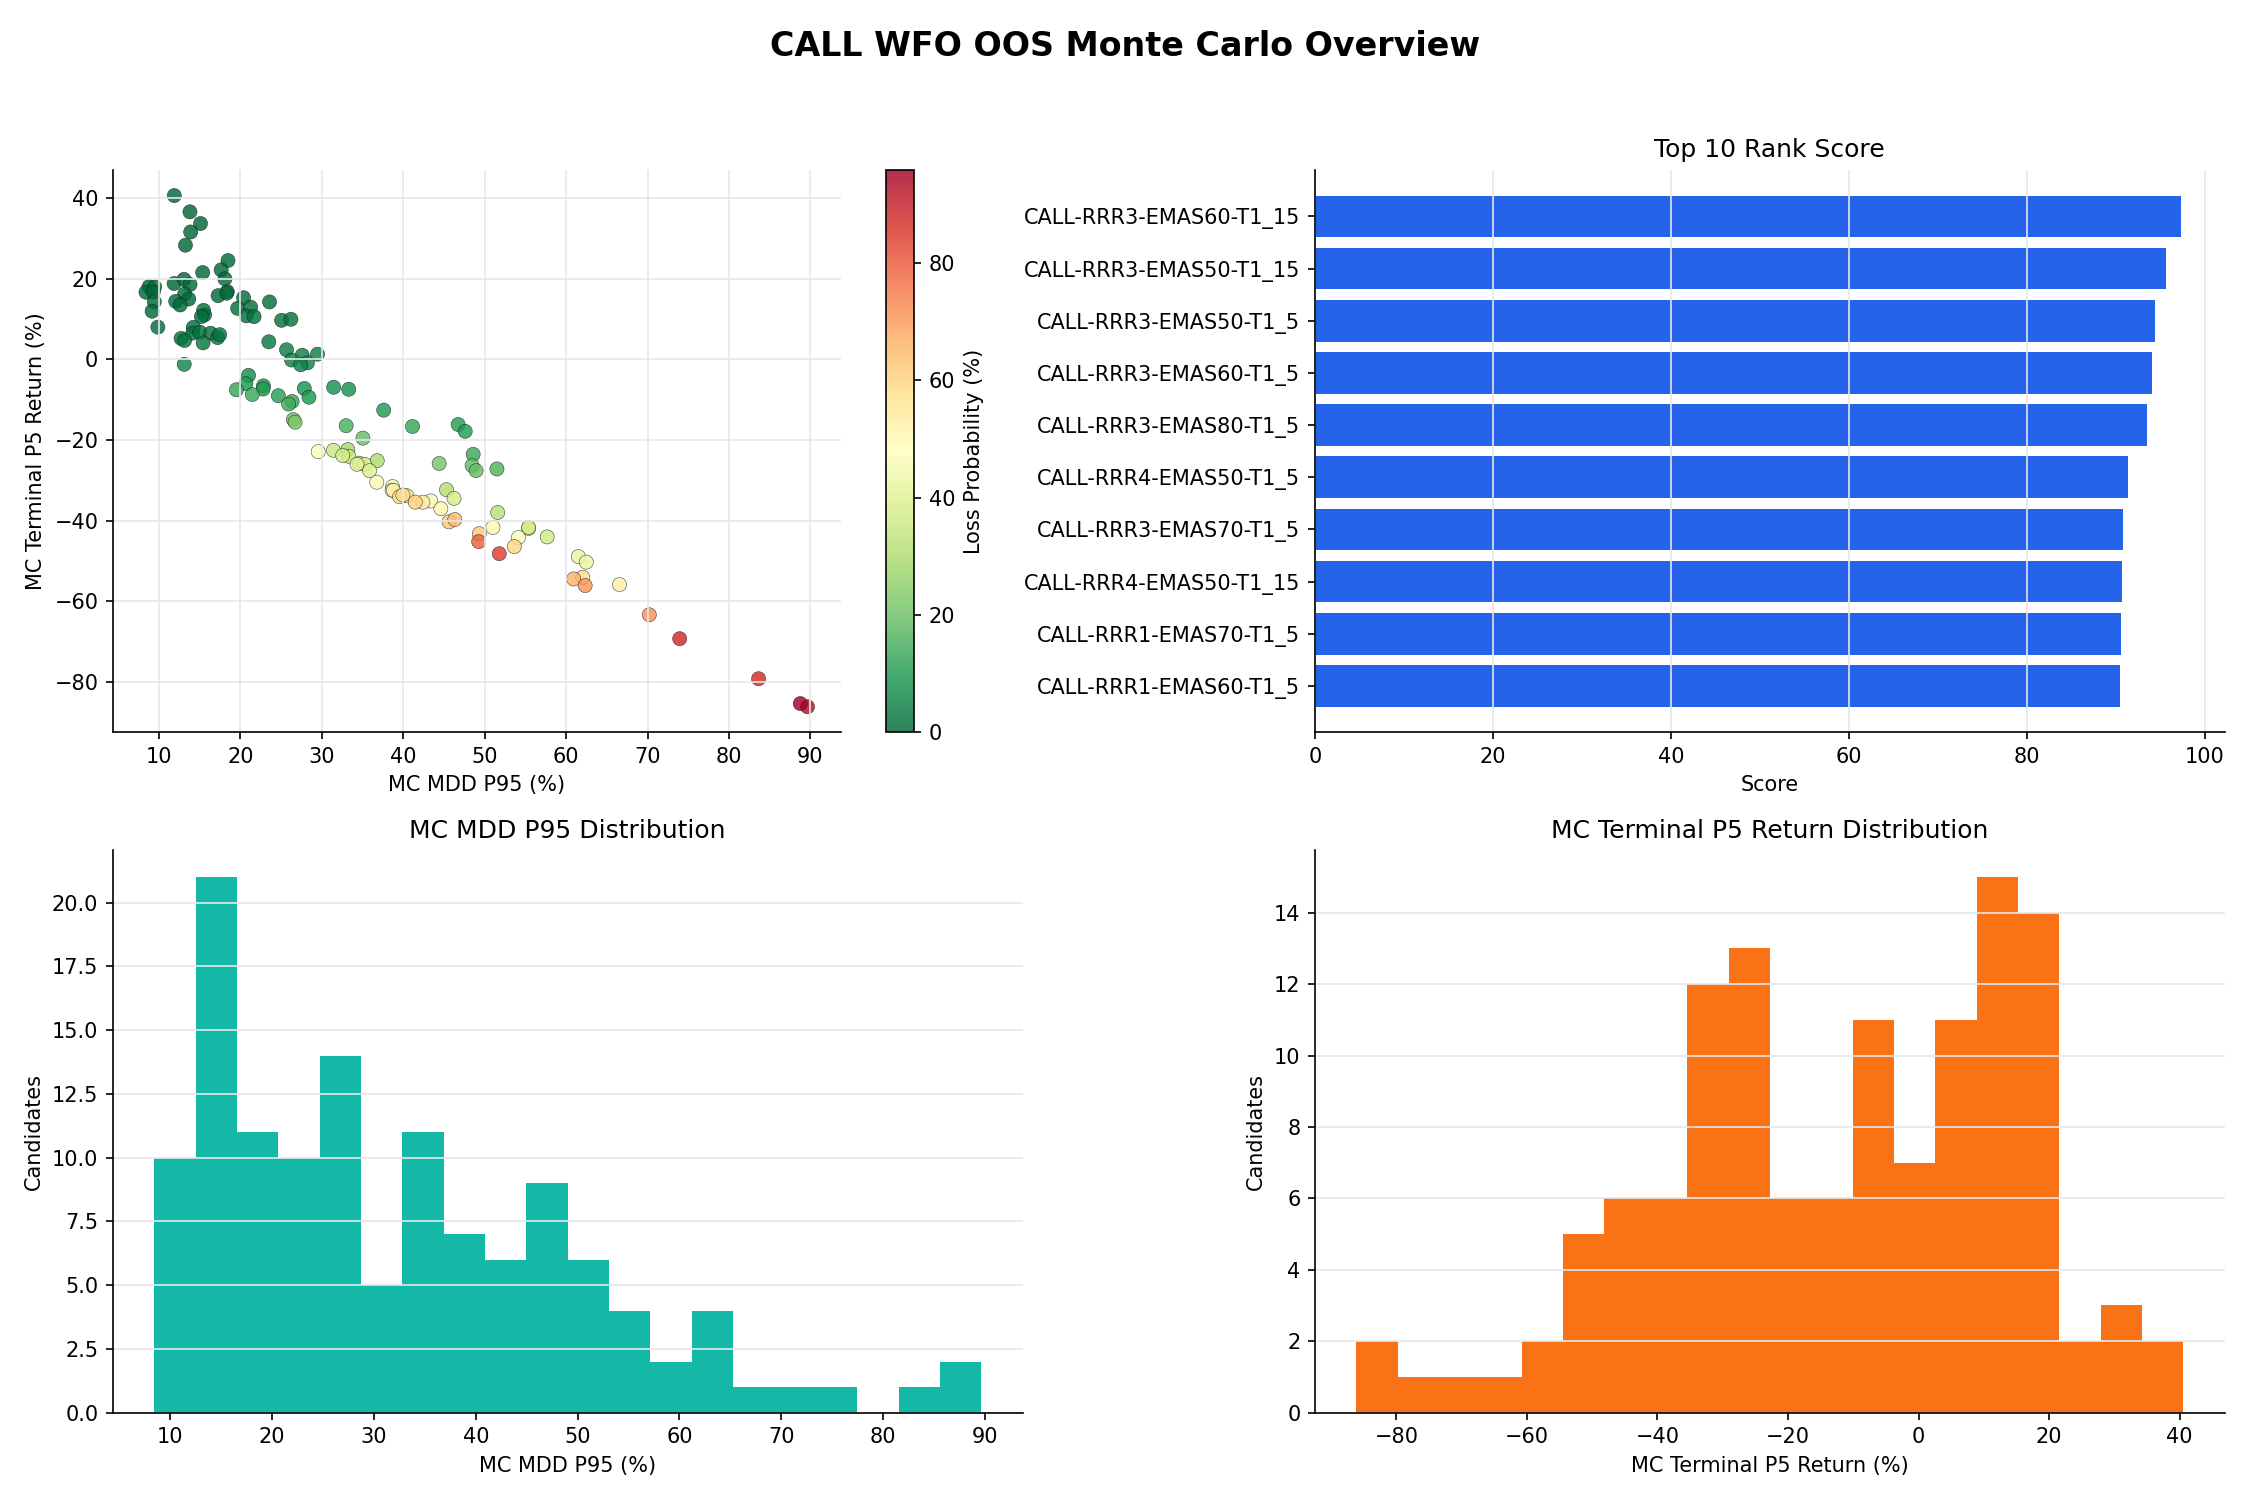
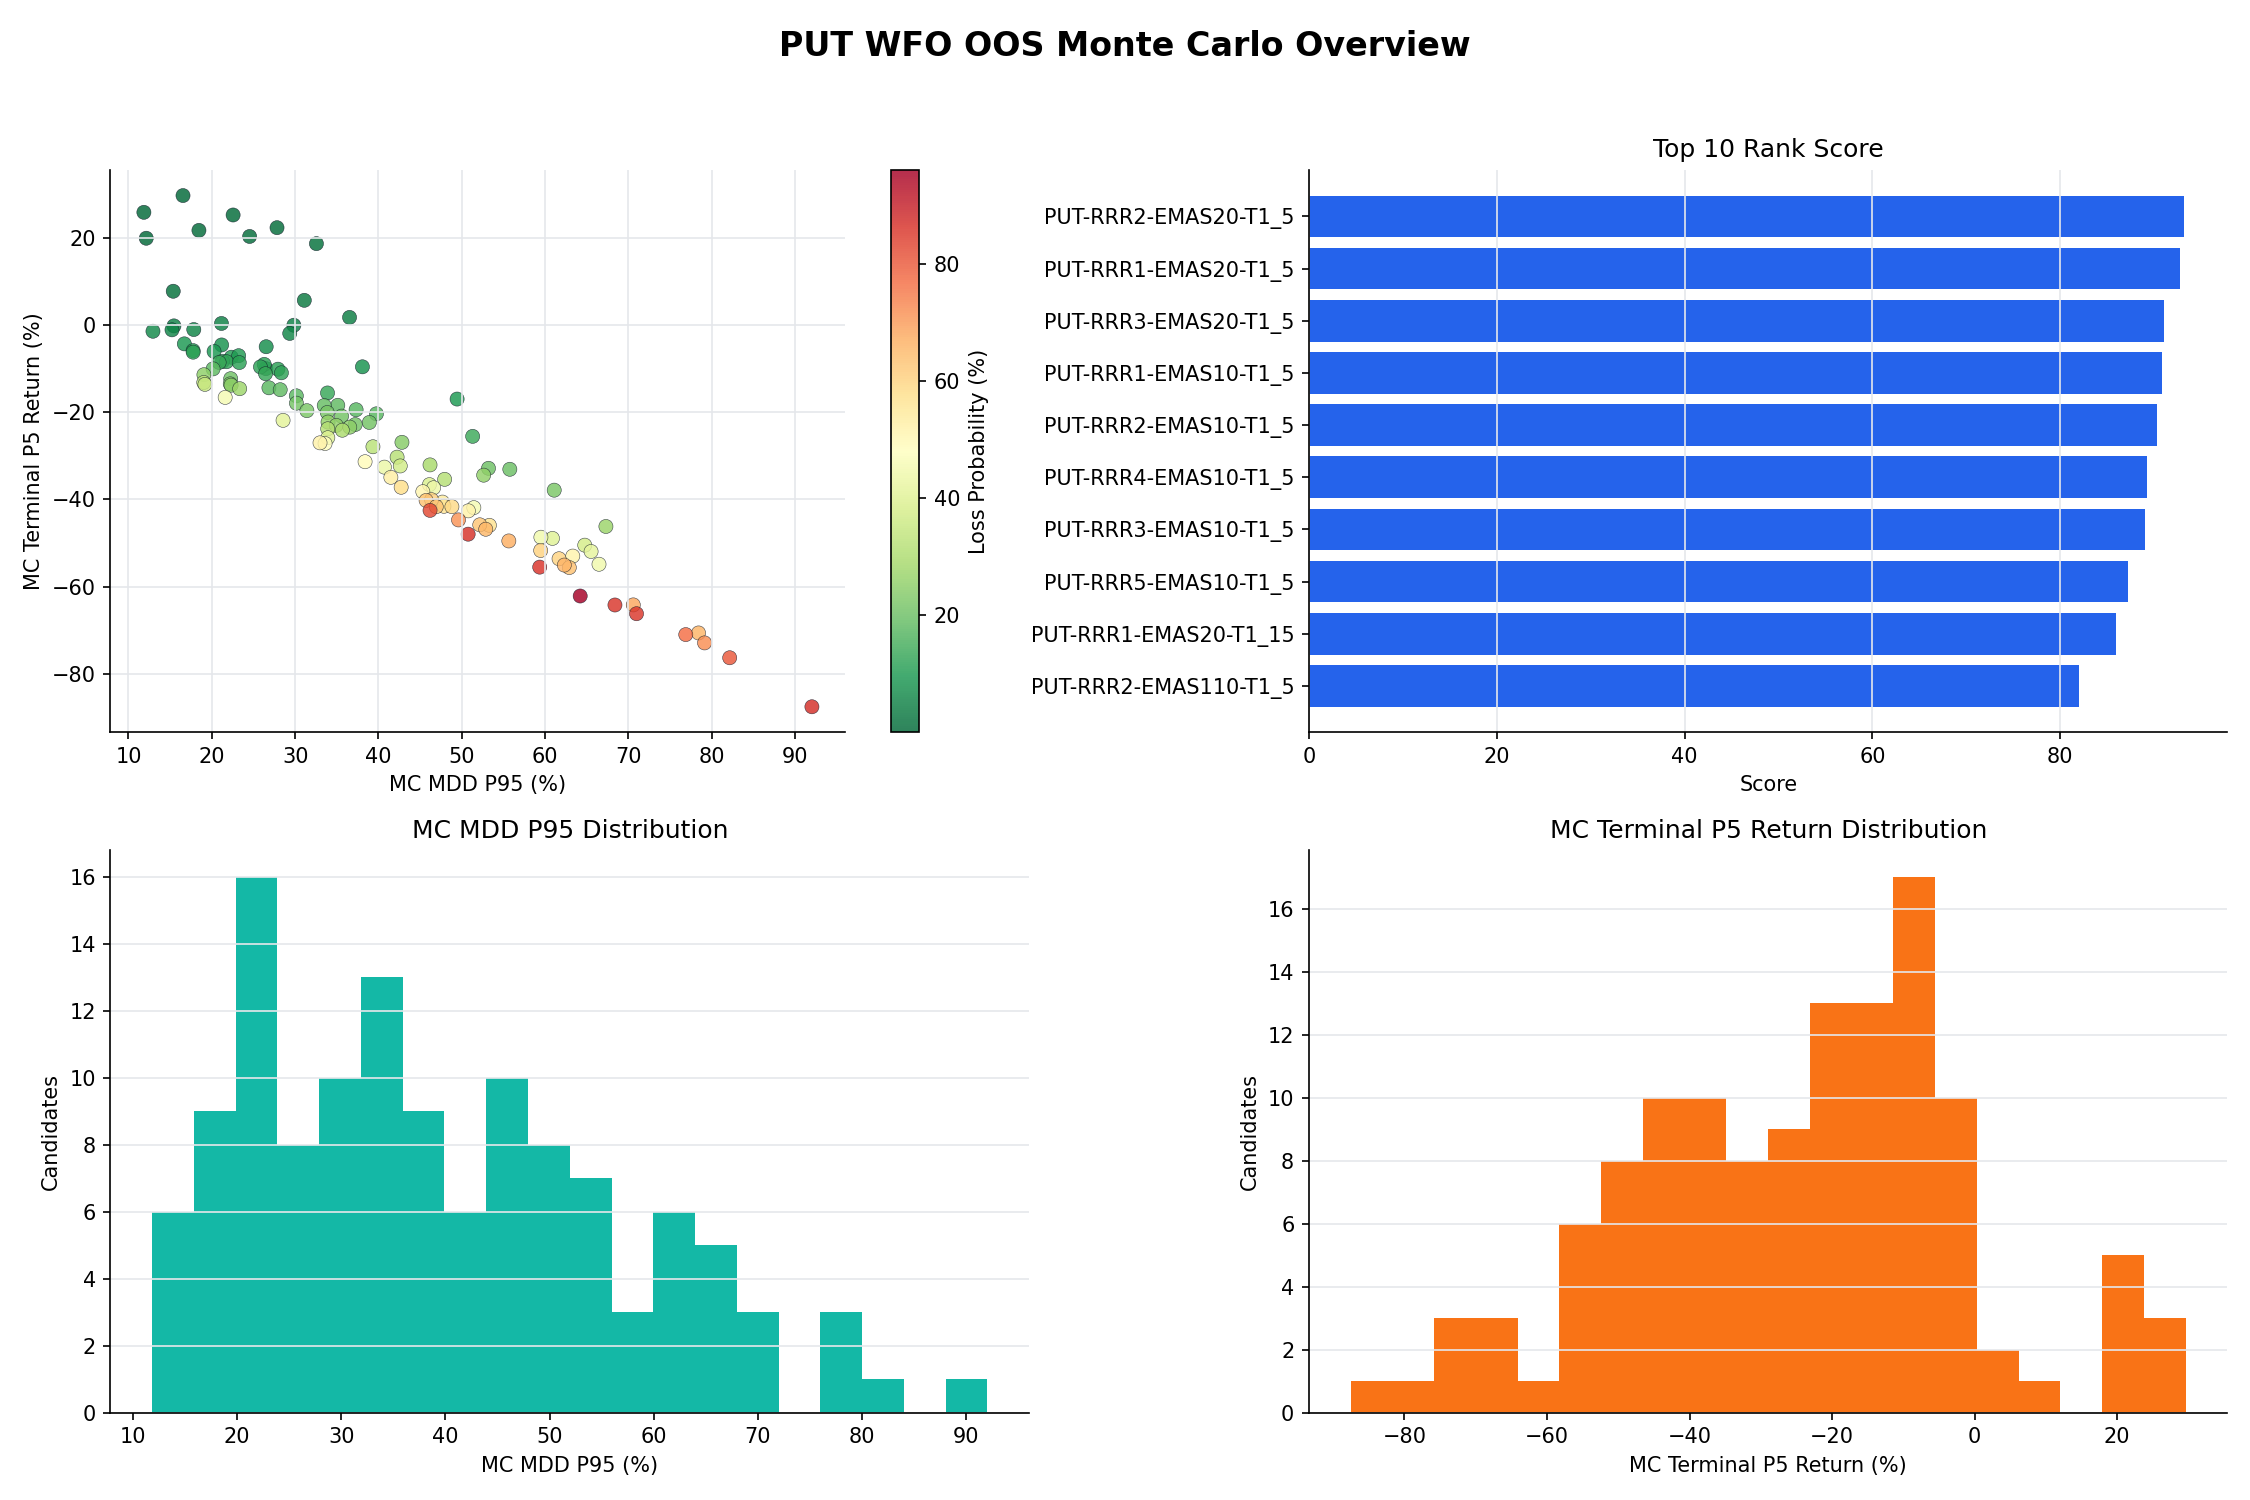
These examples demonstrate how we move from strategy design to out-of-sample evidence and risk interpretation. They are research studies, not live track records.
Case 01 · NQ CALL / PUT
CALL / PUT walk-forward research
How stable are strategy candidates when market chronology is preserved and results are judged outside the training window?
250valid candidates
125 / 125CALL / PUT candidates
10,000paths per candidate
METHOD
Rolling studies separate parameter discovery from monthly out-of-sample evaluation. Selected candidates are replayed, compared by side, and subjected to Monte Carlo stress analysis.
EVIDENCE
The paired NQ overviews show the CALL and PUT candidate pools. Candidate ranks combine loss probability, drawdown-tail estimates, downside terminal value, and original net result.
NQ / CALL Monte Carlo candidate overviewNQ / PUT Monte Carlo candidate overview
LIMITS / The figures are hypothetical simulations using historical data and stated research assumptions. They do not represent live trading or guarantee future outcomes.
CASE 02 · INDEX PRODUCT
Dynamic exposure with an execution bridge
Can a long-horizon index signal express variable exposure through a related micro futures product while keeping execution costs, margin, and residual notional visible?
2005-2026historical research period
18.77%hypothetical CAGR
−33.26%maximum drawdown
010×
020.5×
031×
041.5×
052×
EVIDENCE
The reporting layer records target versus actual exposure, contract and share counts, costs, margin use, overheat states, and the largest drawdown episodes.
INTERACTIVE PLOTLY RESEARCH REPORT
Inspect capital, drawdown, exposure, and execution positions
LIMITS / Results depend on historical prices, modelled commissions and slippage, and simplified execution assumptions. They are not live performance.
Case 03 · Strategy 1
Bad-regime risk gate
Can recent market structure identify environments in which a strategy is more likely to suffer, without becoming another entry signal?
01OOS TRADESLoss labels
→
02LOSS LIFTFeature ranking
→
03BAD REGIMEScore
→
04ON / REDUCED / OFFRisk state
METHOD
Out-of-sample closed trades provide the loss labels. Recent regime features are compared with a trailing baseline, ranked by loss lift, and combined into a BadRegimeScore.
EVIDENCE
The output is a transparent risk state (ON, REDUCED, or OFF) evaluated through avoided loss, missed profit, net gate effect, drawdown, and threshold stability.
LIMITS / A gate is accepted only when multiple diagnostics agree. If missed profit exceeds avoided loss, the report states that directly.